It’s Definitely Getting Not as Bad.
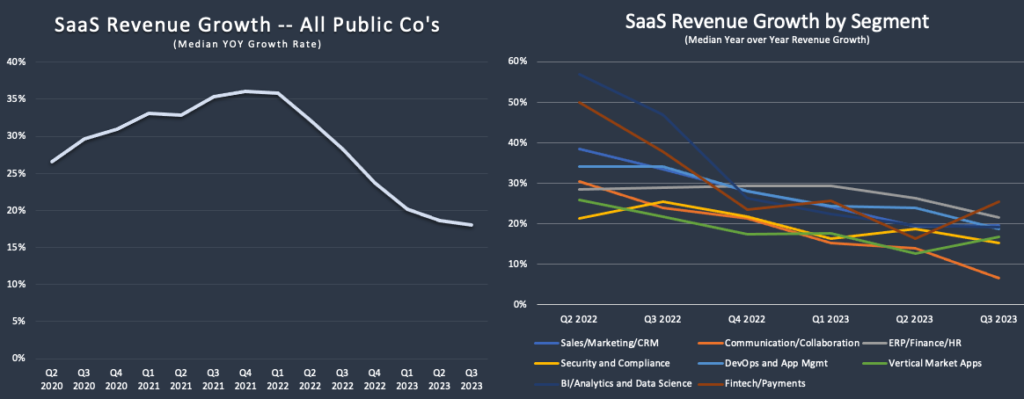
Grammarly did not like that sentence, but it clearly explains the current growth trajectory of public SaaS companies. The precipitous drop in growth rates over the last eighteen months has slowed and is stabilizing in the high teens.
The longer-term trend for all SaaS companies shown in the first chart is the most reliable macro picture of the industry. Q3 2023 is the third quarter in a row where the decrease in the growth rate was less than the quarter before. And the math is getting easier as current revenue is being compared to quarters from one year ago that were already beginning to cool off.
That said, four of eight sectors continued to slow their pace of growth in the quarter, while two sectors were flat, and two saw an increase in growth.
I would be careful reading too much into one-quarter of data on each sector. The data in the chart is only for companies reporting on 9/30, which is 60% of the total universe of public SaaS companies. So when you break it down by segment, N gets relatively small. (The list of companies by segment is on my website, saasonomics.com.)
Even with those caveats, however, the sectors with predominantly usage-based pricing (payments and analytics) have seen the most significant change in growth. This makes sense as there is virtually zero friction to changes in revenue – up or down. Those sectors benefited greatly from the pandemic-induced SaaS bubble of 2020 and 2021 and are still performing well today despite the more dramatic slowdown.
The communications and collaboration sector also has some usage-based attributes; however, it is still looking for its post-pandemic footing and is significantly underperforming all other sectors.
Overall market growth of 15% to 20% is not bad, and with a few more quarters of stabilized growth, you will see the capital markets improve for SaaS. Investors and buyers don’t want to catch a falling knife.


